Posts

Showing posts from June, 2019

Developing a Google Data Studio Connector: Part 2
Image
In part 1 of this tutorial we learnt about what Data Studio is and How to use it. In this tutorial we will kickstart development of our own data studio connector. So let's begin. What are the requirements? A Google account Knowledge of JavaScript A little information on how to use data studio to create visualizations. What is the goal? Data Studio Community Connectors enable direct connections from Data Studio to any internet accessible data source. Here we will be building a simple connector that connects to public GitHub APIs and compares two users data. We will then create visualizations to analyze the GitHub profiles. Step 1: Create a project on AppScript We will use AppScript to write code for our community connector. AppScript makes it easy to deploy our connector and debug it. Visit AppScript and click on New Script to create a new script file. It will open a new project. Rename the project and remove all the contents of code.gs file. We will start wr

Developing a Google Data Studio Connector : Part 1

Image
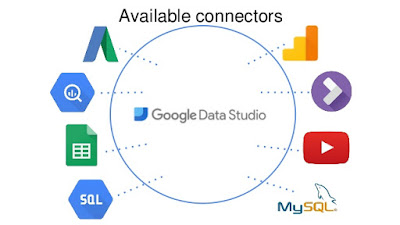
Hello Everyone!! Recently I was asked to develop a Google Data Studio connector & honestly I had no idea what this awesome tool is. So I explored this awesome product by Google, used it and learnt how I can develop a connector for my own needs. It may sound confusing what all these terms mean here :p so don't worry, I am going to explain a step by step tutorial on how to develop your own data studio connector. So we will start from this post and I will introduce you to what is data studio and how this awesome tool works. What is Data Studio? Well, many of you may be knowing about this so you can skip this part and move on to next part. So, data studio is a tool developed by Google (yes, google always comes to your rescue :p) through which you can visualize your data. You can choose from a wide range of options like table, pie chart, time series chart, bar chart, scatter plot etc. the list is long. You can create reports and share them with your team and visualize the