Developing a Google Data Studio Connector : Part 1
Hello Everyone!!
Recently I was asked to develop a Google Data Studio connector & honestly I had no idea what this awesome tool is. So I explored this awesome product by Google, used it and learnt how I can develop a connector for my own needs. It may sound confusing what all these terms mean here :p so don't worry, I am going to explain a step by step tutorial on how to develop your own data studio connector. So we will start from this post and I will introduce you to what is data studio and how this awesome tool works.
What is Data Studio?
Well, many of you may be knowing about this so you can skip this part and move on to next part. So, data studio is a tool developed by Google (yes, google always comes to your rescue :p) through which you can visualize your data. You can choose from a wide range of options like table, pie chart, time series chart, bar chart, scatter plot etc. the list is long. You can create reports and share them with your team and visualize the data easily. Still confused how awesome this tool can be? Here are the samples to blow your mind.
How to use it?
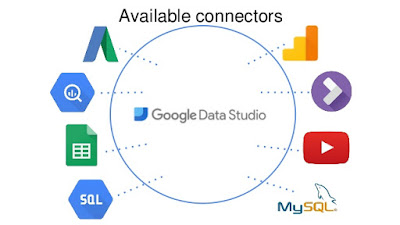
Although this tutorial is about making your own data connector, there are plenty of options available to choose from. Data Studio has around 160+ connectors available, which include connectors developed by Google, community connectors (connectors developed by companies for their customers so that they can visualize their data), open source connectors (developed by open source community). These connectors include option to directly upload a CSV, connect to a MySQL instance, fetch from kaggle dataset etc. So you can easily choose from these options if it covers your needs. For example you can use twitter data connector to visualize details of a tweet. Still if you do not find a suitable connector, make your own ;).
What is a data connector for data studio?
Data studio needs data to make visualizations, so to feed data to data studio we need to create data sources. So using any of the available connector we can fetch the data and make a data source. And using that data source we can create a report. Consider data sources as many books with data and reports as your examination answer sheet. You can write your answer sheet (report) using many books (data sources).
What are we building?
We will be building a simple connector that will fetch the data from GitHub API and then we will compare two GitHub users based on their followers, following, repos and gists. This simple tutorial will give you an basic idea how connectors work behind the scene and you can build your own community connector and publish it.
I hope you got the basic idea of what data studio is. So lets get on to the real stuff and develop a simple data studio connector. Follow part 2 of this tutorial for more details.
I hope you got the basic idea of what data studio is. So lets get on to the real stuff and develop a simple data studio connector. Follow part 2 of this tutorial for more details.


Comments
Post a Comment